Reports
Charts and KPIs that combine data across modules.
2 min read
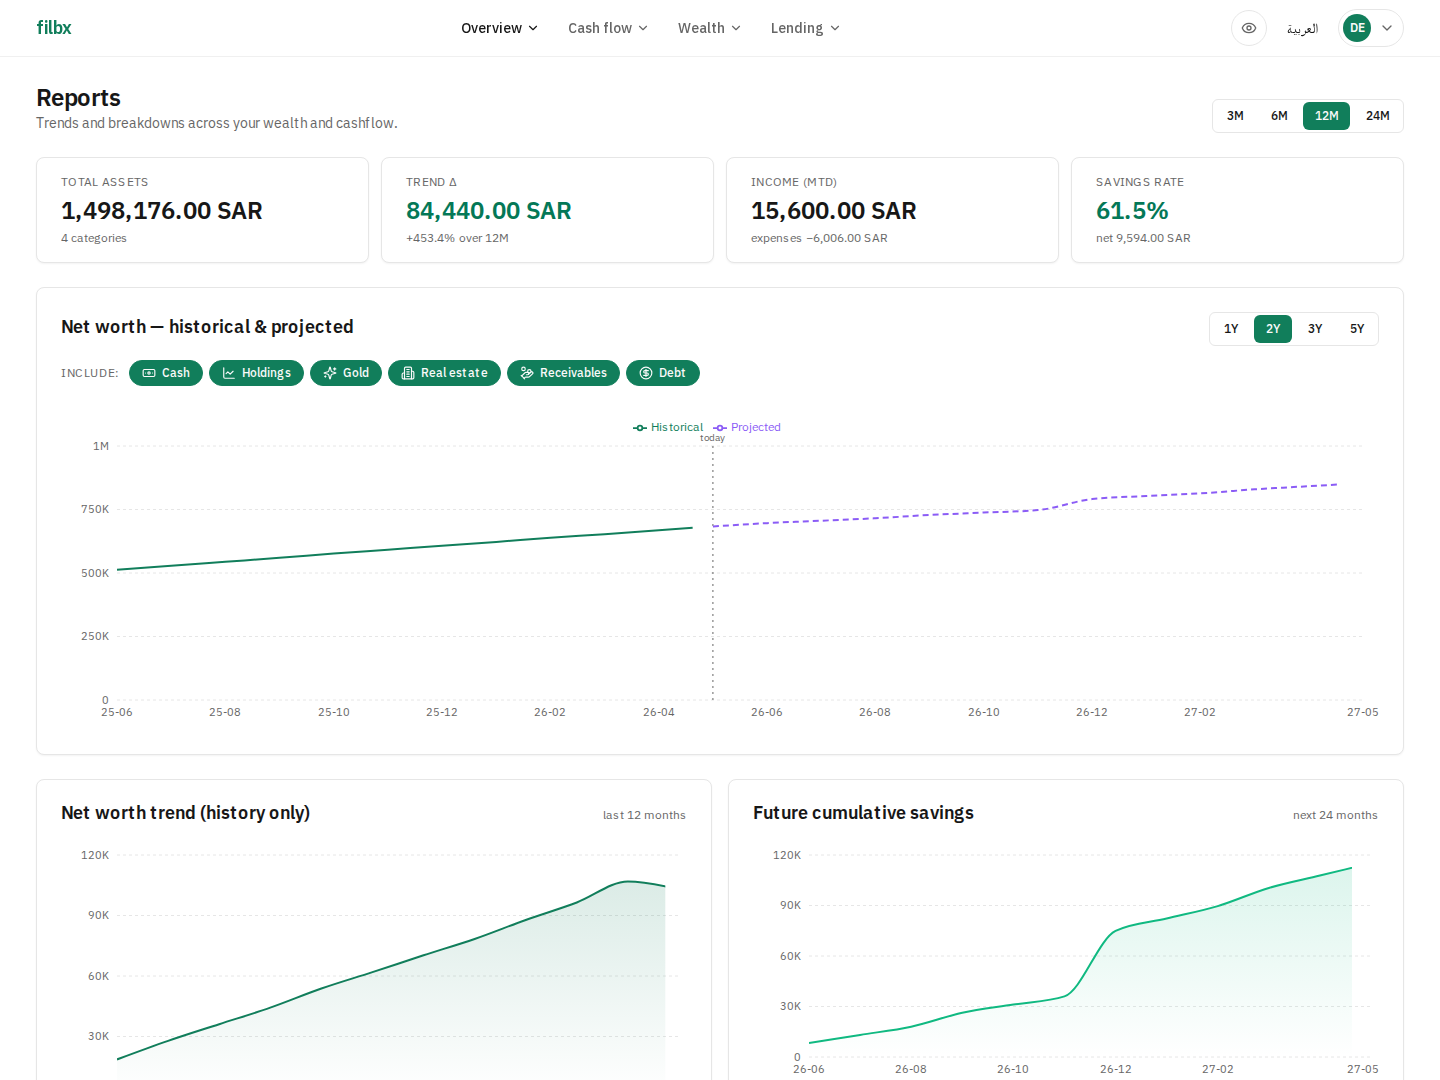
Net worth — historical & projected
The historical curve comes from monthly snapshots, the projected curve from the savings forecast. Use the time-range buttons (3M/6M/12M/24M) for history and the horizon buttons (1Y–5Y) for projection. The bucket filter lets you isolate just cash, just real estate, etc.
Net worth trend
History-only version with KPI tiles: total assets, trend delta, MTD income, and savings rate.
Future cumulative savings
Bar chart showing each future month's net savings. Useful for spotting months where a one-off event will push savings negative.
Credit cards
Per-card utilization, statement balance, current cycle spend, and next payment due. Aggregate utilization is the headline you want under 30%.